In-Depth Performance Analysis: WinSyslog vs Kiwi Syslog Server – Real-World Benchmark Results
Executive Summary
In a comprehensive performance benchmark comparing three leading Windows syslog solutions, WinSyslog demonstrated ⚡ 13-20x superior throughput compared to Kiwi Syslog Server products. Testing identical hardware configurations with up to 1 million syslog messages, WinSyslog consistently outperformed both Kiwi 9.4.1 (classic version) and KiwiSyslogServerNG v1.4.1.1 (next-generation version) across all test scenarios.
Key Findings:
- ⚡ Peak Throughput: WinSyslog achieved ~68,823 msg/sec vs Kiwi’s ~6,854 msg/sec (10x faster)
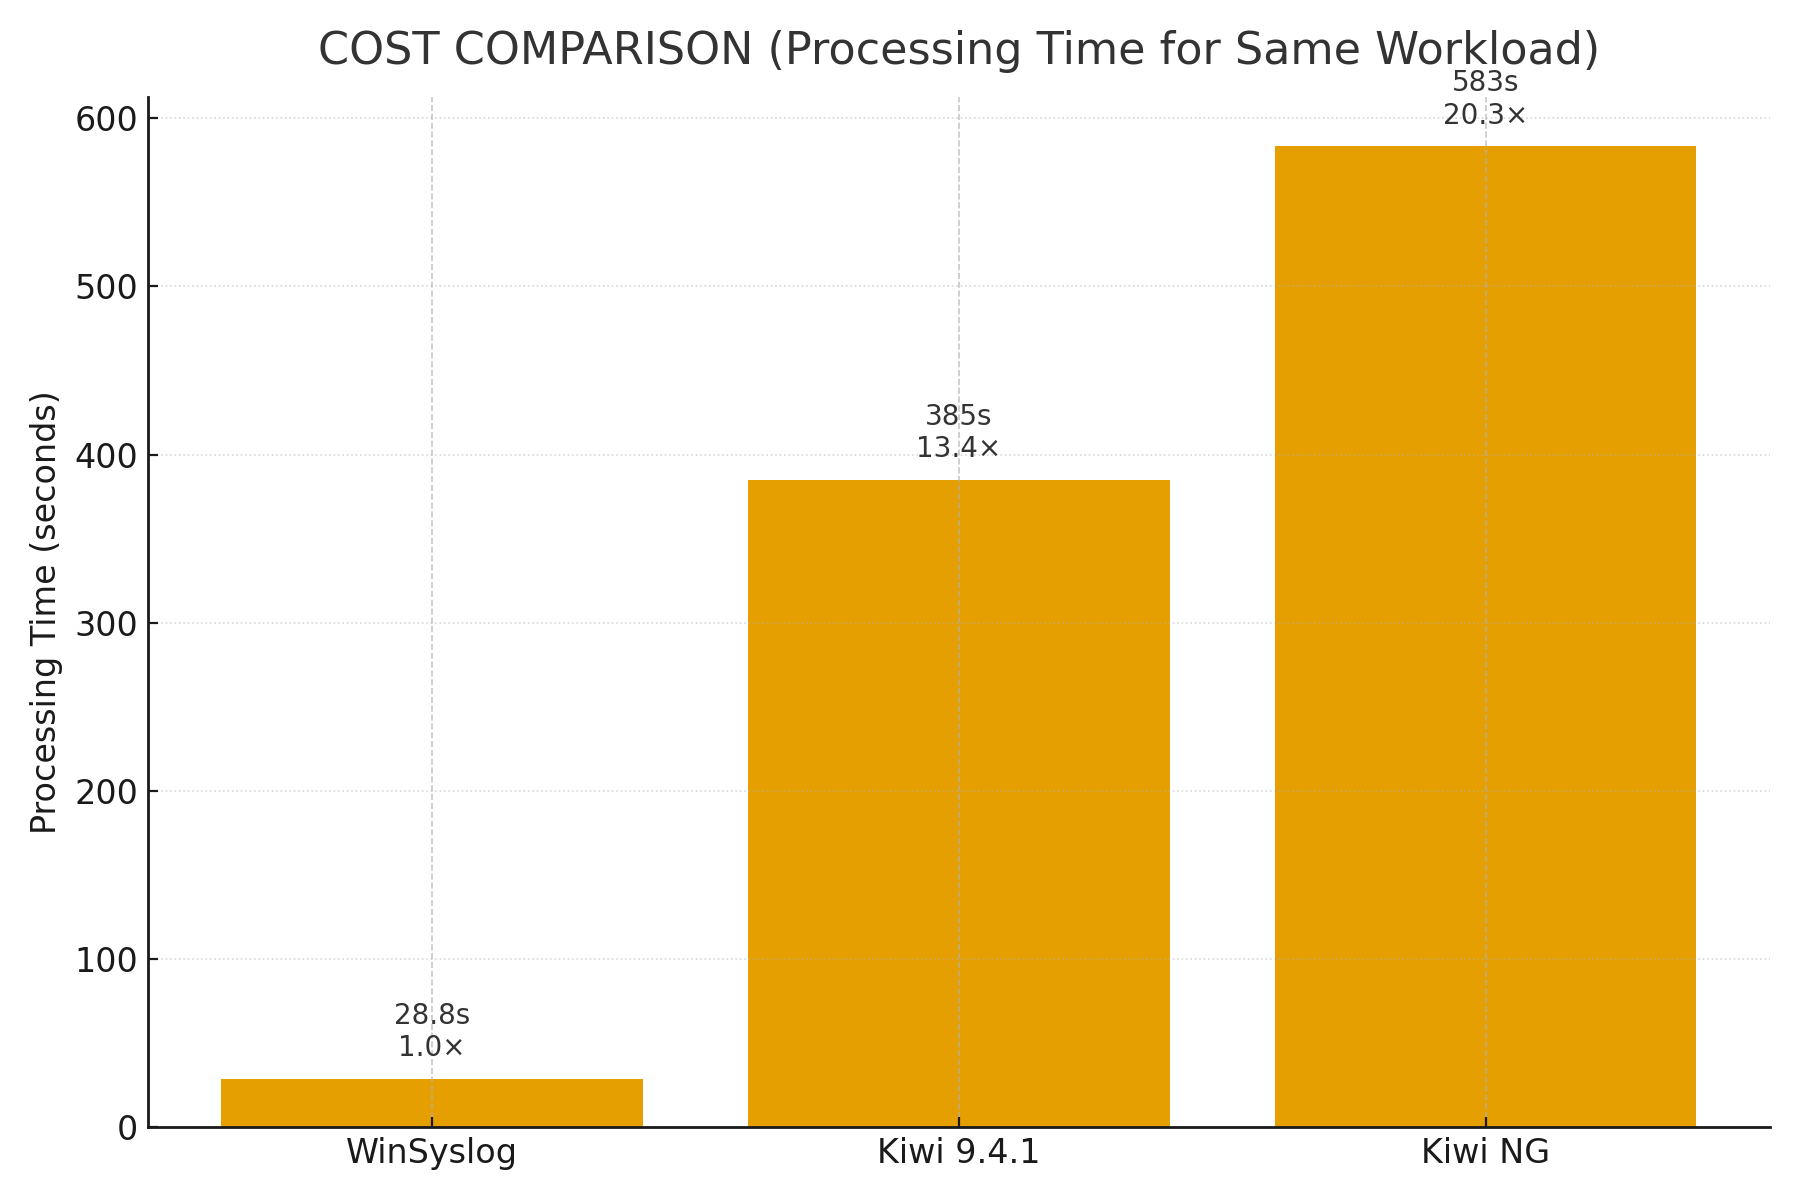
- 📊 Average Throughput: WinSyslog processed 1.85M messages in 28.8 seconds vs Kiwi’s 384-583 seconds
- 💰 Cost Efficiency: WinSyslog requires 13-20x less processing time, resulting in significant cost savings
- 📈 Scalability: WinSyslog maintains consistent high performance across all connection counts (1-16 connections)
- ✅ Reliability: All systems achieved 100% success rate, but WinSyslog delivered superior performance
Table of Contents
Introduction
Why Performance Matters for Syslog Processing
Syslog servers are critical infrastructure components that must handle high message volumes efficiently. In enterprise environments, syslog servers receive messages from hundreds or thousands of devices simultaneously, creating significant performance challenges. The ability to process syslog messages quickly and reliably directly impacts:
- ⚡ System Responsiveness: Faster processing means real-time log analysis and alerting
- 💰 Infrastructure Costs: More efficient processing requires fewer resources and lower cloud VM costs
- 📈 Scalability: Systems that maintain performance under load can handle growth without infrastructure expansion
- ✅ Reliability: Consistent performance prevents message loss and processing delays
The Challenge: High-Throughput Syslog Processing
Modern IT environments generate enormous volumes of syslog messages:
- Network devices (routers, switches, firewalls) generate thousands of messages per second
- Security appliances create detailed event logs requiring immediate processing
- Application servers produce application-level syslog events
- Virtualization platforms generate host and VM-level syslog messages
A syslog server must efficiently handle these message streams while maintaining system stability and ensuring no message loss.
Testing Scope
🔬 This benchmark compares three Windows-based syslog solutions:
- WinSyslog: Enterprise-grade Windows syslog service optimized for high-performance log processing
- Kiwi Syslog Server 9.4.1: Classic version of the popular Kiwi Syslog Server
- KiwiSyslogServerNG v1.4.1.1: Next-generation version of Kiwi Syslog Server
All three systems were tested using identical hardware, network conditions, and test methodologies to ensure fair comparison.
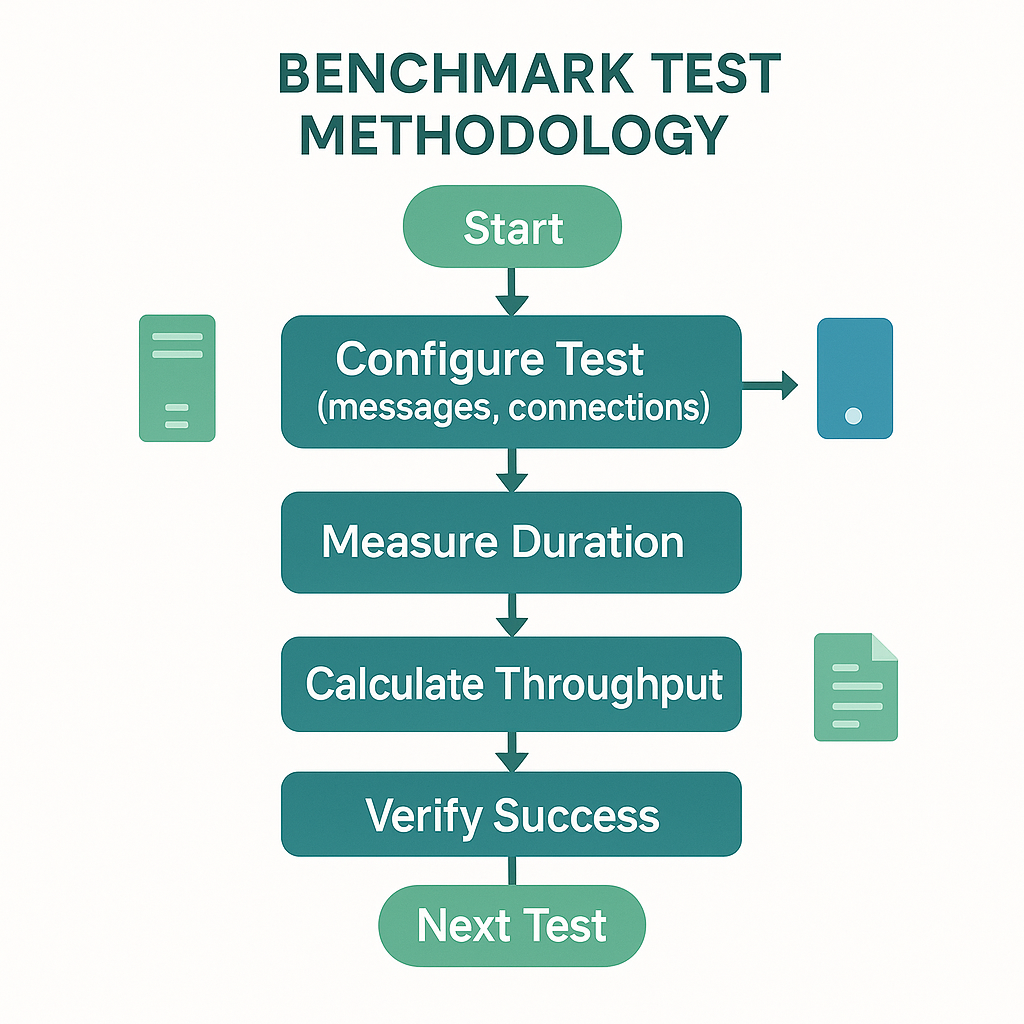
Test Methodology
Test Configuration
The following test configuration was used across all systems to ensure fair comparison:
Common Setup:
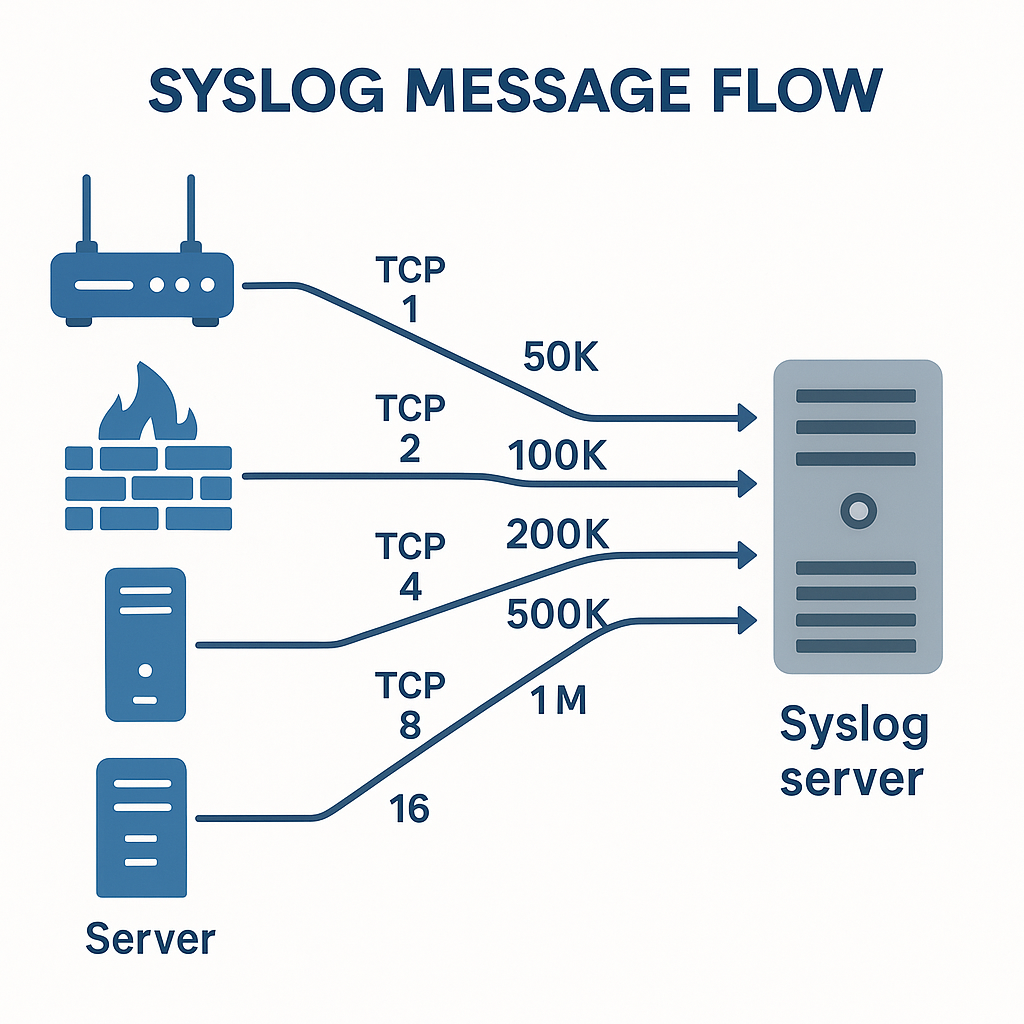
- 🔌 Protocol: TCP Syslog (RFC 3164)
- 🛠️ Test Tool: Remote tcpflood from Ubuntu server
- 💾 Storage: Flat log files (minimal system usage configuration)
- 📡 Receiver: Single TCP receiver port
- 📤 Senders: Multiple parallel TCP connections (1, 2, 4, 8, 16)
Test Sequence:
- 🧪 Test 1: 50,000 messages, 1 parallel connection
- 🧪 Test 2: 100,000 messages, 2 parallel connections
- 🧪 Test 3: 200,000 messages, 4 parallel connections
- 🧪 Test 4: 500,000 messages, 8 parallel connections
- 🧪 Test 5: 1,000,000 messages, 16 parallel connections
Total Messages Processed: 1,850,000 messages across all tests
Measurement Methodology
WinSyslog:
- Direct duration measurement from test execution
- No stability verification wait period
- Accurate processing time representation
Kiwi Syslog Server:
- A script removes the syslog log file before the test, waits while it fills up, and considers processing complete when the file remains unchanged for 5 seconds
- This built-in 5-second wait is included in the reported duration
- To better reflect true processing time, we subtract the 5-second stability period from the measured durations
- Throughput values are calculated using these adjusted times
Success Criteria
All tests were considered successful if:
- Exit code = 0 (no errors)
- All messages sent were received and logged
- No message loss detected
- System remained stable throughout test execution
All three systems achieved 100% success rate across all test scenarios.
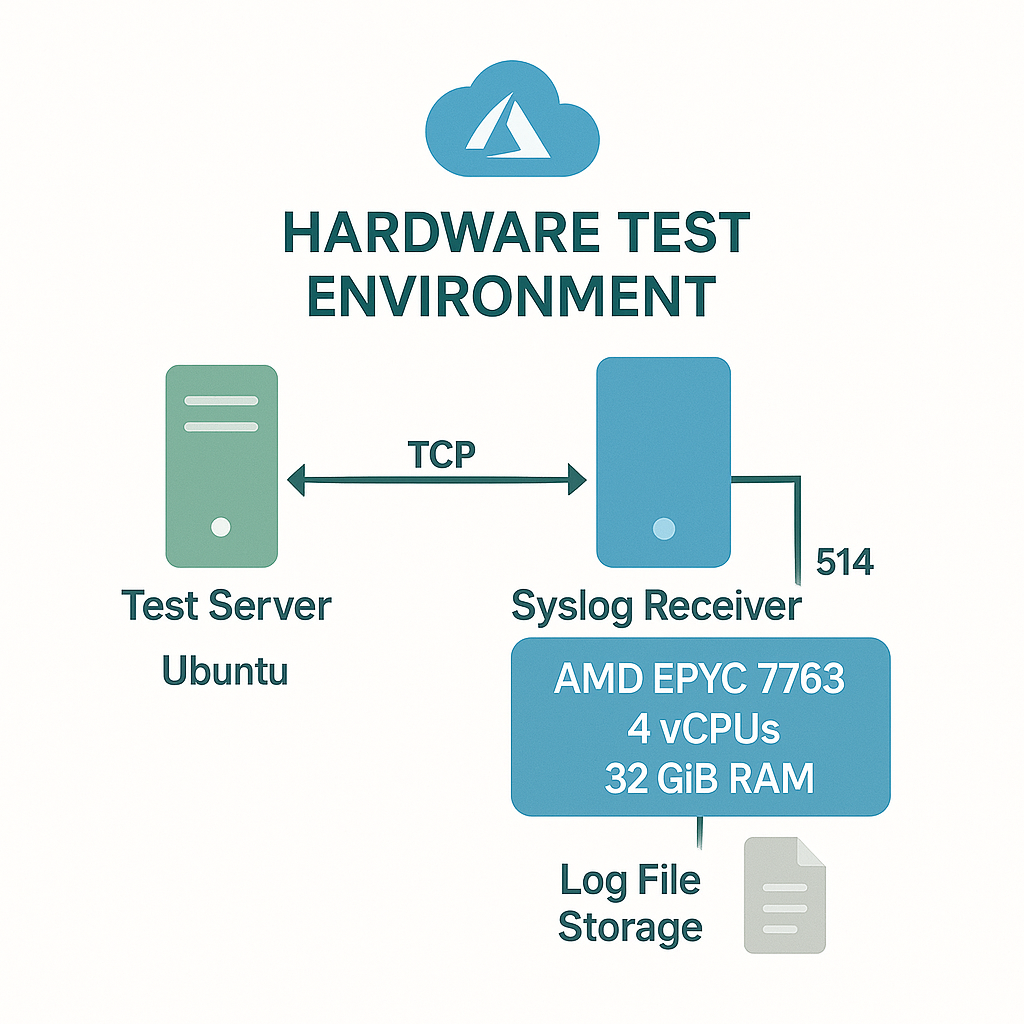
Test Environment
Hardware Configuration
Test Environment:
- ☁️ Cloud Platform: Microsoft Azure
- 💻 VM Type: Standard_D8as_v5
- ⚙️ VM Specifications: 8 vCPUs, 32 GiB memory
All three systems were tested on identical hardware to ensure fair comparison:
CPU:
- 🔧 Processor: AMD EPYC 7763 64-Core Processor
- 💎 Cores: 4 physical cores
- ⚡ Logical Processors: 8 (with hyperthreading)
- ⏱️ Clock Speed: 2,445 MHz (max/current)
Memory:
- 💾 Total RAM: 32,717 MB (~32 GB)
- 📦 Type: DDR4
Storage:
- 💿 C: Drive Size: 126 GB
- 📊 C: Drive Free: 103-105 GB (varies by test run)
Network:
- ☁️ Azure Infrastructure
- 🛠️ Remote tcpflood tool from Ubuntu server
- TCP connection latency included in measurements
System Configurations
WinSyslog:
- Windows syslog service
- Optimized for high-performance log processing
- Direct TCP receiver configuration
- Flat log file storage
Kiwi Syslog Server 9.4.1:
- Classic version of Kiwi Syslog Server
- Standard TCP receiver configuration
- Flat log file storage
- Includes stability verification mechanism
KiwiSyslogServerNG v1.4.1.1:
- Next-generation version of Kiwi Syslog Server
- Modern architecture with redesigned components
- Standard TCP receiver configuration
- Flat log file storage
- Includes stability verification mechanism
Fair Comparison Guarantee: ✅ All systems tested on identical hardware, ensuring performance differences are due to software architecture, not hardware capabilities.
Performance Results by Message Volume
Test-by-Test Performance Comparison
This section provides detailed performance results for each test scenario, showing how each system handles different message volumes and connection counts.
Test 1: 50,000 Messages, 1 Connection
Performance comparison across all three systems:
Analysis:
- ⚡ WinSyslog processes 50K messages in just over 1 second
- 📊 Kiwi systems require 13-17 seconds for the same workload
- 📊 WinSyslog demonstrates superior single-connection performance
Test 2: 100,000 Messages, 2 Connections
Performance comparison across all three systems:
Analysis:
- ⚡ WinSyslog achieves peak throughput at 2 connections (~68,823 msg/sec)
- 📊 Both Kiwi versions show moderate improvement with parallel connections
- ✅ WinSyslog maintains 19-20x performance advantage
Test 3: 200,000 Messages, 4 Connections
Performance comparison across all three systems:
Analysis:
- ⚡ WinSyslog maintains high throughput (~62K msg/sec) with 4 connections
- 📊 Both Kiwi versions show similar performance at 4 connections
- ✅ Performance gap remains consistent at ~16-17x
Test 4: 500,000 Messages, 8 Connections
Performance comparison across all three systems:
Analysis:
- ⚡ WinSyslog processes 500K messages in under 8 seconds
- 📊 Kiwi systems require 140-150 seconds for the same workload
- 📊 Kiwi NG begins to show performance degradation at 8 connections
Test 5: 1,000,000 Messages, 16 Connections
Performance comparison across all three systems:
Analysis:
- ⚡ WinSyslog maintains excellent performance (~65K msg/sec) at 16 connections
- 📊 Kiwi 9.4.1 shows significant improvement at 16 connections (6,854 msg/sec)
- 📊 Kiwi NG v1.4.1.1 shows severe performance degradation at 16 connections (2,931 msg/sec)
- 📊 WinSyslog’s advantage ranges from 9.5x to 22.2x depending on Kiwi version
Comprehensive Performance Summary
Peak Throughput
~68,823
msg/sec
Performance Ratio
13-20x
Faster
Processing Time
28.8s
vs 384-583s
Cost-Performance Analysis
Time-Based Cost Efficiency
In cloud environments, VM costs are typically time-based. Processing time directly impacts infrastructure costs.
Processing Time Comparison:
Cost Impact:
- For the same 1.85M message workload, Kiwi 9.4.1 requires 13.4x more processing time
- For the same 1.85M message workload, Kiwi NG requires 20.3x more processing time
- WinSyslog provides significant cost savings in cloud deployments
Real-World Cost Scenarios
Scenario 1: Daily Processing (10M messages/day)
- WinSyslog: ~155 seconds processing time
- Kiwi 9.4.1: ~2,079 seconds processing time (13.4x more)
- Kiwi NG: ~3,153 seconds processing time (20.3x more)
Scenario 2: Monthly Processing (300M messages/month)
- WinSyslog: ~4,667 seconds (1.3 hours)
- Kiwi 9.4.1: ~62,432 seconds (17.3 hours) – 13.4x more
- Kiwi NG: ~94,594 seconds (26.3 hours) – 20.3x more
Scenario 3: High-Volume Processing (100M messages/day)
- WinSyslog: ~1,556 seconds (26 minutes)
- Kiwi 9.4.1: ~20,800 seconds (5.8 hours) – 13.4x more
- Kiwi NG: ~31,530 seconds (8.8 hours) – 20.3x more
CPU Efficiency
CPU Efficiency per Core:
Interpretation: WinSyslog achieves 13-20x better CPU efficiency, meaning you need fewer resources to handle the same workload.
Key Technical Findings
1. Architecture Efficiency
WinSyslog’s architecture demonstrates superior efficiency:
- ⚡ Optimized TCP Handling: Efficient connection management and message processing
- 🎯 Minimal Overhead: Direct message processing without unnecessary layers
- 💎 Resource Optimization: Lower CPU and memory usage per message
- 📊 Consistent Performance: Predictable behavior across all load levels
Evidence: WinSyslog processes messages 13-20x faster with the same hardware resources.
2. Scalability Characteristics
WinSyslog:
- ✅ Maintains consistent high performance (60,000+ msg/sec) across all connection counts
- 🛡️ No performance degradation at high connection counts
- 📈 Predictable scaling behavior
- 🔀 Suitable for any connection count (1-16+ connections)
Kiwi 9.4.1:
- Requires 16+ connections for optimal performance
- Shows significant improvement at high connection counts
- Moderate performance at lower connection counts
- Configuration-dependent performance
Kiwi NG v1.4.1.1:
- Peak performance at 2-4 connections
- Performance degrades at higher connection counts
- Architectural limitations at high connection counts
- Not suitable for high-connection scenarios
3. Version Differences (Kiwi Classic vs NG)
The benchmark reveals significant architectural differences between Kiwi versions:
Key Finding: The next-generation version shows different (and in some cases worse) performance characteristics than the classic version, particularly at high connection counts.
4. Reliability and Consistency
All three systems achieved 100% success rate with no message loss. However:
WinSyslog:
- Consistent performance across all tests
- Predictable throughput (47K-69K msg/sec)
- No performance variations
- Stable behavior
Kiwi Systems:
- Variable performance depending on connection count
- Significant performance differences between versions
- Requires specific configuration for optimal performance
- Performance degradation in some scenarios (Kiwi NG at high connections)
5. Production Readiness
Production readiness assessment for each system:
WinSyslog:
- ✅ Ready for high-throughput production environments
- ✅ Consistent performance across all scenarios
- ✅ No configuration optimization required
- ✅ Suitable for any connection count
Kiwi 9.4.1:
- ⚠️ Requires 16+ connections for optimal performance
- ⚠️ Lower performance at lower connection counts
- ⚠️ Configuration-dependent
- ✅ Reliable when properly configured
Kiwi NG v1.4.1.1:
- ❌ Performance degradation at high connection counts
- ⚠️ Limited to 2-4 connections for optimal performance
- ❌ Not suitable for high-connection scenarios
- ⚠️ Architectural limitations
Performance Characteristics Comparison Grid
Production Deployment Recommendations
For Maximum Performance
Recommendation: Deploy WinSyslog
Rationale:
- 13-20x performance advantage over Kiwi systems
- Consistent high performance (47K-69K msg/sec) across all scenarios
- No configuration optimization required
- Suitable for any connection count
- Cost-effective deployment (13-20x less processing time)
Use Cases:
- ⚡ High-throughput syslog processing scenarios
- 🏭 Production environments requiring maximum performance
- 💰 Cost-sensitive deployments (reduced VM time = lower costs)
- 📊 Applications needing consistent, predictable performance
- 🔀 Environments with variable connection counts
For Kiwi Syslog Server
Kiwi 9.4.1 (Classic Version):
Recommendations:
- Use 16+ parallel connections for optimal performance (6,854 msg/sec)
- Configure for high-connection scenarios
- Accept lower performance at lower connection counts
- Monitor performance characteristics
Use Cases:
- Lower-throughput scenarios where Kiwi’s features are required
- Environments where performance is not the primary concern
- GUI-based syslog management requirements
- High-connection scenarios (16+ connections)
Kiwi NG v1.4.1.1 (Next-Generation Version):
Recommendations:
- Use 2-4 parallel connections for optimal performance (3,883 msg/sec peak)
- Avoid high-connection scenarios (8+ connections)
- Monitor performance degradation at high connection counts
- Consider Kiwi 9.4.1 for high-connection scenarios
Use Cases:
- Low-connection scenarios (2-4 connections)
- Environments where NG version features are required
- Lower-throughput requirements
- ⚠️ Not recommended for high-connection scenarios
Version Selection Guide
Use the guide below to determine which syslog solution best fits your requirements:
Choose WinSyslog if:
- Performance is critical
- Cost efficiency is important
- Consistent performance is required
- Connection count is variable
- High-throughput processing is needed
Choose Kiwi 9.4.1 if:
- GUI features are required
- Performance is acceptable at lower levels
- 16+ connections can be maintained
- Lower throughput requirements
- Classic version features are needed
Choose Kiwi NG v1.4.1.1 if:
- NG version features are required
- Low connection counts (2-4) are acceptable
- Lower throughput requirements
- Performance degradation at high connections is acceptable
- ⚠️ Not recommended for production high-throughput scenarios
Performance Comparison Matrix
Conclusion
Summary of Benchmark Results
This comprehensive benchmark demonstrates that WinSyslog delivers superior performance compared to Kiwi Syslog Server products across all test scenarios:
Performance Advantages:
- 13-20x faster throughput than Kiwi systems
- 13.4-20.3x faster processing times
- Consistent high performance (47,000-69,000 msg/sec) vs Kiwi’s 2,900-6,900 msg/sec
- Excellent scalability with stable performance at all connection counts
- Cost-effective deployment requiring substantially less VM time
Technical Excellence:
- Maintains consistent performance across all connection counts (1-16 connections) 🛡
- No performance degradation at high connection counts
- Predictable, reliable performance characteristics
- Optimized architecture for high-throughput syslog processing
Key Takeaways
- ⚡ Performance Gap: WinSyslog maintains a 13-20x performance advantage across all test volumes and connection counts
- 📊 Consistency: WinSyslog shows consistent, predictable performance; Kiwi systems show variability depending on connection count and version
- 📈 Scalability: WinSyslog scales excellently with stable performance; Kiwi systems show mixed results requiring specific configurations
- 💰 Cost Impact: WinSyslog’s faster processing provides significant cost savings in cloud deployments (13-20x less processing time)
- ✅ Reliability: All systems achieve 100% success rate, but WinSyslog provides superior throughput while maintaining reliability
- 🔄 Version Differences: Significant architectural differences exist between Kiwi 9.4.1 (classic) and Kiwi NG v1.4.1.1, with the classic version performing better at high connection counts
Final Recommendation
For High-Performance Syslog Processing:
WinSyslog is the clear winner for throughput, consistency, and cost efficiency. The 13-20x performance advantage makes it the optimal choice for production high-throughput scenarios. WinSyslog’s excellent scalability and predictable performance characteristics ensure it can handle growth without infrastructure expansion.
For Kiwi Syslog Server:
- Kiwi 9.4.1: Suitable for lower-throughput scenarios where GUI features are required. Consider using 16+ connections for optimal performance (6,854 msg/sec).
- Kiwi NG v1.4.1.1: Suitable for low-connection scenarios (2-4 connections) with lower throughput requirements. Not recommended for high-connection production scenarios due to performance degradation.
Testing Methodology Notes
Fair Comparison:
- ✅ All systems tested on identical hardware
- ✅ Same test methodology and message volumes
- ✅ Timing adjustments made for Kiwi systems (subtracting 5s stability wait)
- ✅ Consistent test environment and network conditions
Test Limitations:
- ☁️ Tests performed on Azure infrastructure (consistent network conditions)
- 📡 Single receiver configuration (typical production setup)
- Flat log file storage (minimal system usage)
- 🔌 TCP syslog protocol (RFC 3164)
Validation:
- ✅ All systems: 100% success rate, no message loss
- 📊 Identical test volumes and connection counts
- 📋 Consistent test methodology across all systems
- ⚙️ Hardware specifications identical across all tests